Census: Finding the rock god
The headline aggregate census statistics were released last year but only at the local authority level, i.e., Camden-wide. As the data crunchers do their thing, the Office of National Statistics will start to release the numbers at the local level.
This allows us to start looking at West Hampstead in more detail.
It’s stats, which means methodology. Bear with me (or scroll down for the numbers). Census data is collated at the “output area” level. There are MSOAs, which correspond roughly to ward-sizes, LSOAs are one-size smaller, and OAs are at the street/postcode level. They all have numerical codes and it can be quite hard to find out what they actually correspond to on the ground!
However, it is possible to see that Greater West Hampstead roughly covers four MSOAs with the evocative names of Camden 005, 010, 013 and 016. This map shows the area they cover.
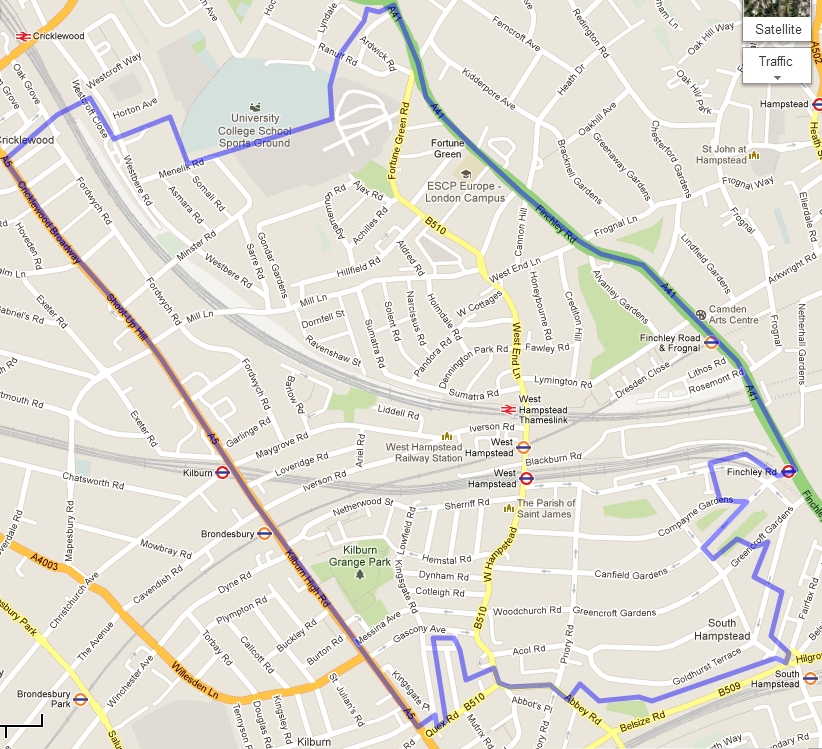
With more time you could play around with the LSOAs to get the “perfect” boundaries for the area you want to cover, but we’re going to stick with MSOAs for now. The great advantage of these areas over the ward boundaries is that they do not change as much, which makes comparison over time easier.
Right that’s your geographical stats lesson out of the way.
The latest release of stats gives us the total population at these lower levels, the ethnic make-up of the area, and the stated religious affiliation (or lack of one).
The population of West Hamptead is 33,751, up from 31,004 since the 2001 census – a rise of 8.8%. The bulk of this growth has been in the north of the area in Fortune Green and the “heart” of West Hampstead. These two MSOAs experienced population growth of more than 10%. Given all the building work slated for the next few years, the 2021 census should show even greater growth. The area as a whole though is broadly in line with national population growth rates and lower than the London growth rate of 14%.
Ethnic mix
Less than half of West Hampstead’s population consider themselves to be British in one form or another – 44.6% to be precise. Of the 94 ethnic categories in the census, only Punjabi, “Black European”, “Black and Chinese” have no representatives in West Hampstead, which is quite astonishing. Here are the other highlight numbers:
- 4.9% “Other Western European” (seems to be almost everything apart from Italian);
- 4.8% to be African,
- 4.2% to be Irish,
- 3.6% Indian or British Indian,
- 2.77% “Other White”,
- 2.75% “European Mixed”,
- 2.1% Australian or New Zealander,
- 2.1% Bangladeshi,
- 1.7% North American and so on.
Comparisons with 2001 are tricky as I simply can’t find the comparable 2001 chart. It’s possible to get the broad ethnic breakdown by each MSOA but if anyone can send me a link to the full dataset I shall be grateful
Religion
Just over a third of whampers (35.9%) class themselves as Christian, which is well below the national average of 59.3%). A quarter of people have no religion (this includes people who state “Jedi”), and a fifth didn’t asnwer the question.
- 8.7% identify as Muslim
- 6.5% identify as Jewish
- 1.2% identify as Buddhist
- 92 people identify as Jedi
Unlike the ethnic breakdown there are a lot of religions not represented in the area (there are 56 religions mentioned in the census). One of the delights of the very detailed output is that you can get quite precise about where these people live. So, for example, according to the data, the one Heavy Metal devotee probably lives on Woodchurch or Acol Road (or was staying there that night).
So if you’ve got a neighbour on those streets who plays heavy metal and you don’t like it, complain at your peril – you may not be able to infringe his or her right to worship 😉


